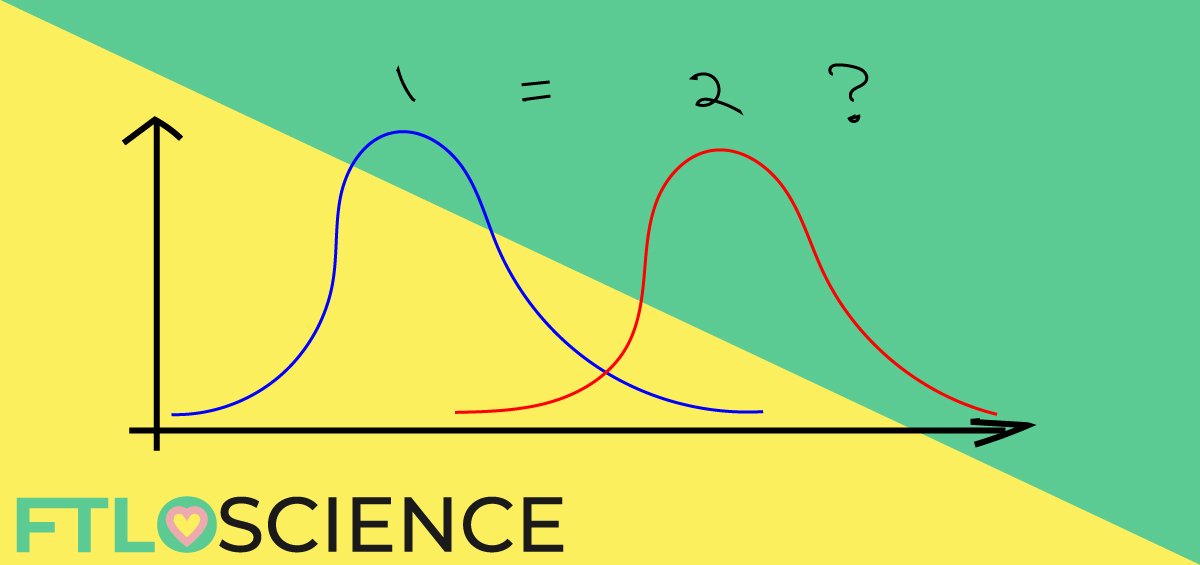
One thing that regularly stumps scientists is the handling of data. We seem to be very good at generating obscene amounts of it, but representing it meaningfully can be a little off-putting, unless you happen to be a bioinformatician. Let’s continue our tutorial series by introducing Two-Sample t-Tests and Paired t-Tests to see how we can easily incorporate statistical analysis into our work.
Of course, the calculations involved can be done on a simple calculator but your task will be made much easier with the use of spreadsheet software (Excel) or more specialized tools which are available in most high schools and universities (Minitab, Prism, SigmaPlot, etc.).
Each will have its own tutorials on carrying out these tests and so this article will not be heavily technical but rather focus on the correct application of statistical testing.
Table of Statistical Analysis
| Test | When To Use | An Example |
| 1 sample t-test | Tests if the mean of a single population is equal to the hypothesized value | A lecturer claims that the mean time taken to complete a quiz is 1 hour. From a sample data set, can we reject this claim? |
| 2 sample t-test | Tests if the difference between means of two independent populations is equal to a hypothesized value | Does the mean quiz score of female students differ significantly from the mean quiz score of male students? |
| paired t-test | Tests if the difference between means of dependent or paired observations is equal to a hypothesized value | The mean response time of adults before and after they have consumed alcohol. Is the difference significant enough to conclude that alcohol affects response time? |
| ANOVA | Tests for statistical difference among means for more than two populations | Studying the effectiveness of three types of pain reliever: aspirin vs. tylenol vs. ibuprofen |
When to Use a t-Test?
A t-test is a form of hypothesis testing that uses a set of sample data to test a hypothesis for the entire population. It is used when the population standard deviation (σ) is unknown and the sample size is small (n<30). In real-world samples, we don’t usually have a basis for knowing σ.
Since the t-distribution becomes equivalent to the normal distribution (bell curve) when the sample size is large, the correct practice is:
- If σ is known, use the normal distribution.
- If σ unknown:
- If n>30, use the normal distribution.
- If n<30, use a t-distribution.
Last time out, we looked at the one-sample t-test and how we could use it for hypothesis testing in the example ‘determining whether the mean time for completing an online quiz is statistically different from the lecturer’s claim of 1 hour’. If you are unsure of the terminology and confidence intervals, it might be a good idea to take a look at the one-sample t-test first.
Example: Two-Sample t-Test
The two-sample t-test is also used for hypothesis testing, to determine if the means of two independent populations are significantly different.
For example, “does the mean quiz score of female students (x̅FS) differ significantly from the mean quiz score of male students(x̅MS)?” In this case, the hypotheses can be quantified:
- The null hypothesis (H0): There is no difference in the means (x̅FS – x̅MS = 0)
- The alternative hypothesis (H1): There is a significant difference (x̅FS – x̅MS ≠ 0)
Using software generates a similar set of parameters as a one-sample t-test, but with, well, two samples! The key value here is the difference between sample means, which can then be used to generate a 95% confidence interval, based on this estimate and the standard deviation of the samples.
If the 95% confidence interval does not include H0 (the value 0, in this case) you can reject the null hypothesis and conclude that a difference exists between the two samples.
Example: Paired t-Test
A paired t-test is in fact performing a one-sample t-test on the differences between paired observations. Paired observations are related in some way, such as an individual before and after a certain treatment, or an individual who is subject to similar (hence paired) treatments concurrently.
Formulating the null and hypotheses using the example given above ‘The mean response time of adults before (x̅BA) and after (x̅AA) they have consumed alcohol’:
- The null hypothesis (H0): There is no difference before and after (x̅AA – x̅BA = 0)
- The alternative hypothesis (H1): There is a significant difference (x̅AA – x̅BA ≠ 0)
The data generated from a group of 100 people taking a reaction time test 30 minutes after consumption of one ‘standard’ drink (14 g alcohol) would look something like this:
Paired t-test Results for After – Before
| Variable | n | Mean | St Dev | 95% CI (lower, upper limit) | T-statistic | p-value |
|---|---|---|---|---|---|---|
| After | 100 | 1372.6 | 896.2 | – | – | – |
| Before | 100 | 1272.8 | 873.7 | – | – | – |
| Difference | 0 | 99.8 | 245.5 | 51.1, 148.5 | 4.06 | 0.000 |
From the p-value of 0.000, we can reject the null hypothesis at the 0.05 α-level and conclude that reaction times increased after individuals consumed one ‘standard’ unit of alcohol.
About the Author

Sean is a consultant for clients in the pharmaceutical industry and is an associate lecturer at La Trobe University, where unfortunate undergrads are subject to his ramblings on chemistry and pharmacology.


