
Pharmaceutical companies use stability studies to find the shelf life of their drug product and learn about its degradation pathways. However, many chemicals are stable under storage conditions. Here’s how we can use the Arrhenius equation to predict drug degradation rates using accelerated stability study data.
Understanding the Arrhenius Equation
Long-Term vs. Accelerated Stability Data
Stability tests are an essential part of drug development, where possible degradation pathways and the shelf life of a drug product are studied. However, long-term studies can take several years since some drug ingredients are incredibly stable under normal storage conditions.
To shorten the development and estimate the shelf life of a drug, pharmaceutical companies can perform accelerated stability studies. Accelerated studies involve higher temperatures than the medicine would experience under normal storage and transport, producing valuable degradation data.
Using the Arrhenius equation, we can use this accelerated degradation rate and extrapolate it to estimate the degradation of a drug under normal conditions—without actually waiting for the medicine to degrade.
Forms of The Arrhenius Equation
We can measure a drug’s degradation rate using a number specific to a chemical: the rate constant (k). Drugs with a higher rate constant degrade faster (assuming everything else remains identical). You can read more about pharmacokinetics in our introductory pharmacology guide.
The rate constant is dependent on temperature, as seen from the Arrhenius equation:
k= Ae^{\frac{-Ea}{RT}}| Term | SI Units | Description |
|---|---|---|
| k | Zero order: M time-1 First order: time-1 Second order: M-1 time-1 | Rate constant (specific to the chemical and temperature) |
| A | Same as the corresponding rate constant (k) | Arrhenius constant (independent of temperature) |
| Ea | Joules per mole (J mol-1) | Activation energy (minimum energy requirement) |
| R | 8.314 Joules per Kelvin per mole (J K-1 mol-1) | Ideal gas constant |
| T | Kelvin | Temperature |
We can rewrite the Arrhenius equation in different ways:
\begin{align*}
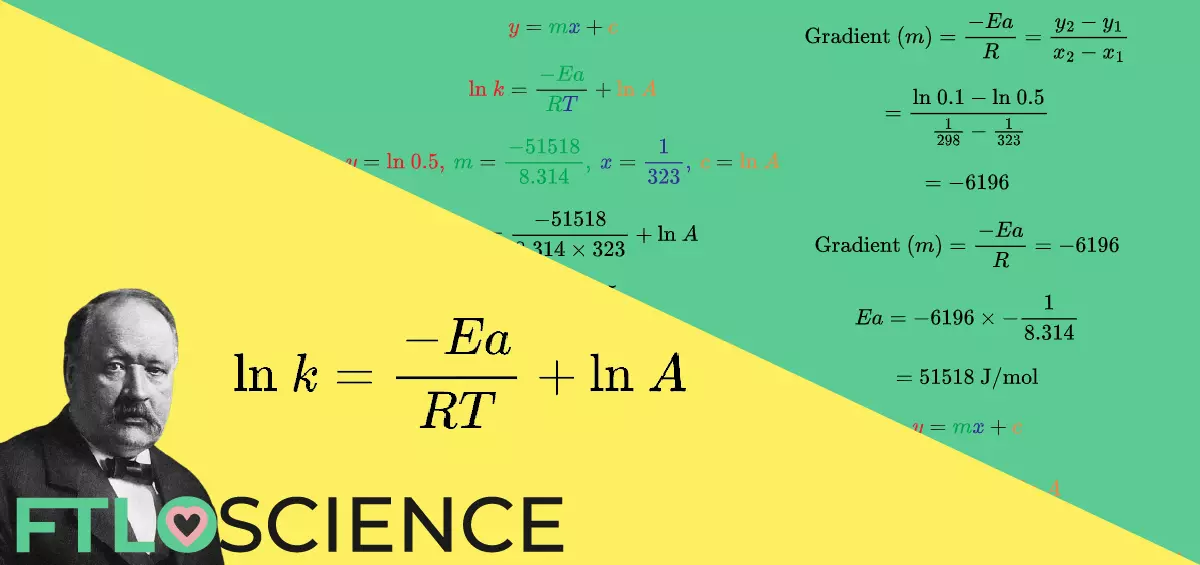
&\text{ln}\ k= \frac{-Ea}{RT}+\text{ln}\ A\\[0.1in]
&\frac{Ea}{RT}=\text{ln}\ A-\text{ln}\ k\\[0.1in]
&Ea=\left( \text{ln}\ A-\text{ln}\ k \right)RT\\[0.1in]
&T=\frac{Ea}{R}\times \frac{1}{ \text{ln}\ A-\text{ln}\ k}
\end{align*}
The Relationship Between Rate Constant and Temperature
Despite being a constant, the rate constant (k) is specific to a certain temperature. If temperature changes, the rate constant—and hence the rate of a reaction—changes too!
We can use this to our advantage in stability studies, where we can find the rate constant of drug degradation at different temperatures without having to do the actual measurement!
We can write the Arrhenius equation in the form of straight line (y = mx + c), where:
\color{Red} y\color{Black} =\color{Green} m\color{Blue} x\color{Black}+\color{Orange} c\\[0.1in]
\color{Red}\text{ln}\ k\color{Black}= \frac{\color{Green}-Ea}{\color{Green}R\color{Blue}T}\color{Black}+\color{Orange}\text{ln}\ A\\[0.1in]
\color{Black}\text{where }\color{Red}y\color{Black}=\color{Red}\text{ln}\ k,\: \color{Green}m\color{Black}=\color{Green}\frac{-Ea}{R},\\[0.1in]\color{Blue}x\color{Black}=\color{Blue}\frac{1}{T},\: \color{Orange}c \color{Black}=\color{Orange}\text{ln}\ A
We can now draw a y-axis vs. x-axis plot, with m as the slope gradient and c as the y-intercept:
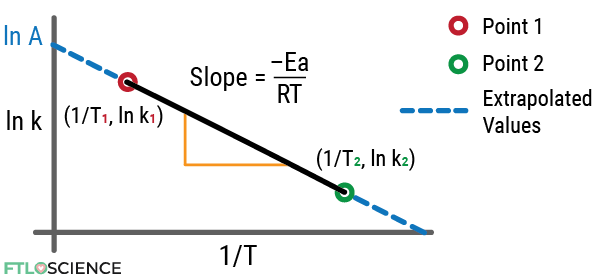
We will see how this Arrhenius plot becomes useful for calculating different unknown parameters using worked examples in the next section.
Applying the Arrhenius Equation (Worked Examples)
Calculating Activation Energy (Ea) and Arrhenius Factor (A)
Let’s say we know the rate constant for the first-order degradation of a drug. At 323 K (50 °C), it has a rate constant of 0.5/hour. At 298 K (25 °C), it has a rate constant of 0.1/hour.
| Temperature (K) | Rate Constant (hr-1) | |
|---|---|---|
| Point 1 | 323 | 0.5 |
| Point 2 | 298 | 0.1 |
Using these two points, we can form an Arrhenius plot:
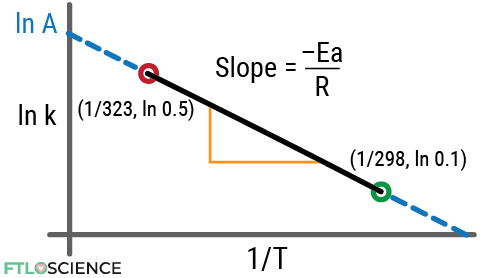
We can calculate the gradient of the slope (m) using the formula:
\text{Gradient }(m)=\\[0.1in]\frac{-Ea}{R}=\frac{y_{2}-y_{1}}{x_{2}-x_{1}}\\[0.1in]
=\frac{\text{ln }0.1-\text{ln }0.5}{\frac{1}{298}-\frac{1}{323}}\\[0.1in]
=-6196
Using the gradient, we can find the activation energy (Ea) of the degradation reaction:
\text{Gradient }(m)=\\[0.1in]\frac{-Ea}{R}=-6196\\[0.1in]
Ea=-6196 \times-\frac{1}{8.314}\\[0.1in]
=51518\text{ J/mol}
Next, we can calculate the Arrhenius factor (A) since ln A represents the y-intercept term. We can choose a data point to provide the x and y values:
\color{Red} y\color{Black} =\color{Green} m\color{Blue} x\color{Black}+\color{Orange} c\\[0.1in]
\color{Red}\text{ln}\ k\color{Black}= \frac{\color{Green}-Ea}{\color{Green}R\color{Blue}T}\color{Black}+\color{Orange}\text{ln}\ A\\[0.1in]
\color{Black}\text{where }\color{Red}y\color{Black}=\color{Red}\text{ln}\ 0.5,\: \color{Green}m\color{Black}=\color{Green}\frac{-51518}{8.314},\\[0.1in]\color{Blue}x\color{Black}=\color{Blue}\frac{1}{323},\: \color{Orange}c \color{Black}=\color{Orange}\text{ln}\ A\\[0.1in]
Now we substitute the values using the information that we have and solve for A:
\text{ln}\ 0.5=\frac{-51518}{8.314\times323}+\text{ln}\ A\\[0.1in]
\text{ln}\ A=18.5\\[0.1in]
A=e^{18.5}=10.8\times10^{7}
Calculating the Rate Constant for Unknown Temperature
The Arrhenius equation is useful to estimate rate constant data for temperatures not experimentally obtained. In accelerated stability studies, we use data measured at higher temperatures and extrapolate it back to find the rate constant at storage conditions.
For example, a drug requires freezing storage conditions (-20 °C/253 K). However, because it is so stable at these temperatures, we might have to wait years to get usable degradation data. To get around this, we can get experimental data at higher temperatures:
| Temperature (K) | Rate Constant (hr-1) | |
|---|---|---|
| Point 1 | 323 | 0.5 |
| Point 2 | 298 | 0.1 |
This is the same data as the example above, which means we can use the same activation energy (Ea) and Arrhenius constant (A) values. To calculate the rate constant (k) at temperature 253 K, we substitute these known values into the Arrhenius equation:
\text{ln}\ k= \frac{-Ea}{RT}+\text{ln}\ A\\[0.1in]
=\frac{-51518}{8.314\times253}+\text{ln}\ \left(10.8\times10^{7}\right)\\[0.1in]
\text{ln}\ k=-6\\[0.1in]
k=e^{-6}=2.5\times10^{-3}=\\[0.1in]0.0025\:hr^{-1}
This tells us that the rate constant at freezing (253 K) is 40 times smaller than the rate constant at room temperature (298 K)!
Moisture-Corrected Arrhenius Equation
As we extrapolate further away from experimental values, the accuracy of the Arrhenius estimate worsens. This is because drug molecules degrade through different pathways under different conditions, while this extrapolation assumes that the pathway remains the same, but at temperature-dependent rates.
Humidity plays a significant role in the stability of a drug product since water can hydrolyze molecules while providing a solvent that accelerates other degradation reactions. This poses a problem as the original Arrhenius equation doesn’t consider humidity. This leads to poor shelf-life estimates, which can have a negative impact on the drug product’s regulatory approval process.
For better stability data, we can use the moisture-corrected Arrhenius equation, which considers both the temperature and relative humidity between two data points:
\text{ln}\ k= \frac{-Ea}{RT}+\text{ln}\ A+\color{Blue} \left( B\times \text{RH} \right)With new terms:
| Term | SI Units | Description |
|---|---|---|
| B | Number from 0 (low) to 0.09 (high) | Moisture constant (susceptibility of chemical to moisture-driven degradation) |
| Relative Humidity | 0 to 100% | Relative amount of moisture in the air (compared to maximum 100%) |
About the Author

Sean is a consultant for clients in the pharmaceutical industry and is an associate lecturer at La Trobe University, where unfortunate undergrads are subject to his ramblings on chemistry and pharmacology.