Spectroscopy is not only an important part of a scientist’s arsenal but also a big part of everyday life. Take a moment to appreciate that the myriads of colors in dyes and paints are made possible by chemical compounds that possess certain spectral characteristics, or how the chemical composition of distant galaxies can be characterized based on their observed spectra. In this tutorial, we will be discussing how infrared spectroscopy works, along with its applications.
What is Infrared Spectroscopy?
Spectroscopy is classified as any interaction between matter and electromagnetic radiation, usually expressed as a measurement of radiation intensity against a function of wavelength. When a compound is exposed to infrared radiation, the transitions between its ground and excited vibrational states can be measured.
These transitions are unique to the bonds within the molecule, such that the entire spectrum of transitions paints a sort of molecular portrait. Infrared spectroscopy is relatively quick and easy to perform, accommodating either liquid or solid samples.
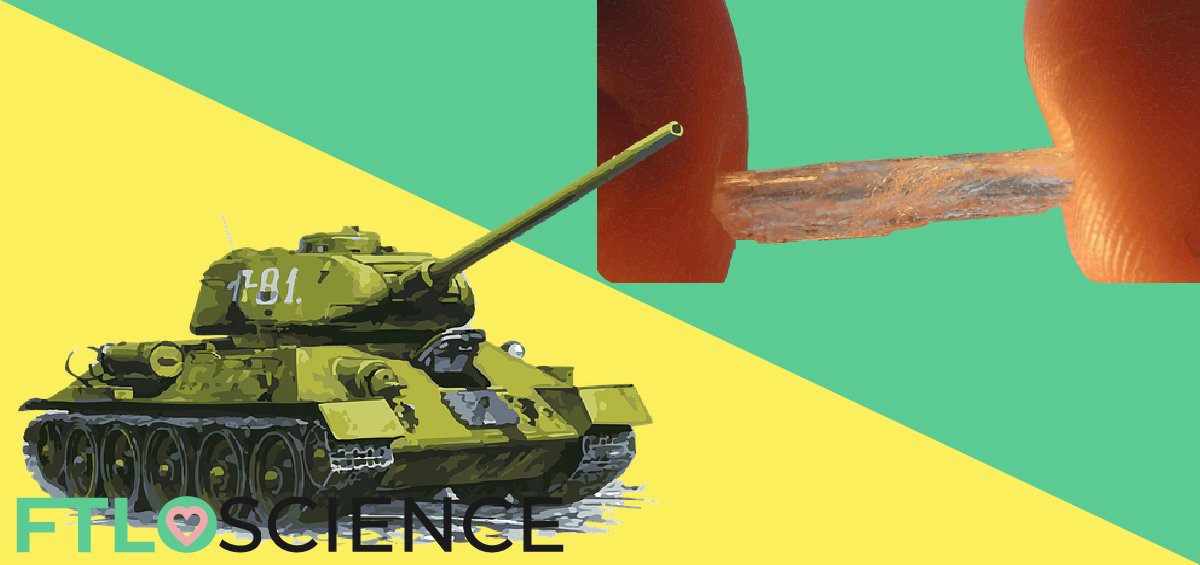
Liquid samples can be screened directly, while solid samples are usually mixed with potassium bromide (KBr).

Molecular Vibrations
Infrared spectroscopy comes about from vibrational transitions, that are described in the harmonic approximation as the frequency at which a diatomic molecule vibrates. This frequency is proportional to the square root of the force constant (second derivative of the energy change with bond length) divided by its reduced mass (the product of the two atomic masses divided by their sum).

In other words, frequency (energy) increases with force constant (think about it as the stiffness of the bond) and decreases with larger masses of the atoms involved in the bond. However, molecules are more complex (or perhaps less complex) in the sense that their vibrational transition energies are quantized. Only photons that are of specific energy will induce these vibrational states, which are so-called ‘allowed’ energy levels for the system as a whole.
Inside an Infrared Spectrophotometer
An infrared spectrophotometer consists of a filament that is able to generate radiation (source), a collimator that allows for the focusing of this beam as well as a beam splitter known as an interferometer. The purpose of splitting the beams of light into two is to diverge the light into two different paths by the use of mirrors, which are then directed onto the sample and the detector. The optical path difference (OPD) between the beams is what the detector picks up as it passes through the sample.

The OPD interferogram is then converted to a function of intensity (% transmission) vs. frequency (wavenumber, cm-1) through a Fourier transform. If you would like to dive into the technical and more mathsy side of Fourier transform infrared (FTIR) spectra generation, Newport has a great resource.

Functional Group Analysis
The IR spectrum of each molecule is unique and is widely used in ‘fingerprinting’ to identify a known molecule. It is used in all areas of science, from pharmaceutical analysis to environmental chemistry, forensics and even astronomy.
Experimental and Calculated Spectra
Experimental spectra that are stored in a database can be used to provide clues to the structure of a newly synthesized molecule. For example, when we want to better understand the structure of a potential drug in lead discovery studies. Oftentimes, unique features in a spectrum are compared to and taken as evidence for features (such as functional groups) in a newly synthesized compound.
Calculated spectra can also be generated with a proposed structure of the synthesized molecule. A high degree of similarity with the measured spectrum is evidence that the calculated molecule is at least very similar to the measured molecule, while a lack of similarity can be interpreted as the predicted structure being incorrect.
Limitations of Infrared Spectroscopy
Infrared spectra are normally obtained in the mid-infrared region (4000–400 cm-1) because the absorption bands of most organic compounds and inorganic ions fall within this range. Near (12800–4000 cm-1) and far (50–1000 cm-1) infrared absorption is also possible, but is not as commonly acquired.
However, once the number of atoms in a compound reaches a certain number the overlap between bands makes its spectrum very messy. This makes identifying particular bonds extremely difficult and hence the characterization of unknown molecules is today conducted using nuclear magnetic resonance (NMR) techniques.
Functional group analysis is still a very powerful tool that FTIR allows us to perform. If we want to confirm the presence of certain functional groups (aldehydes, amides, etc.) on our molecule, their vibrational energies and peak intensities would be similar depending on their environment. This is especially useful for monitoring intermediate reaction steps in organic synthesis!

Once again, a big big thank you for taking the time to read this piece. We hope that you enjoyed it, and have gained an appreciation of the finer workings of IR spectroscopy the next time you are required to form a KBr disc (again!)
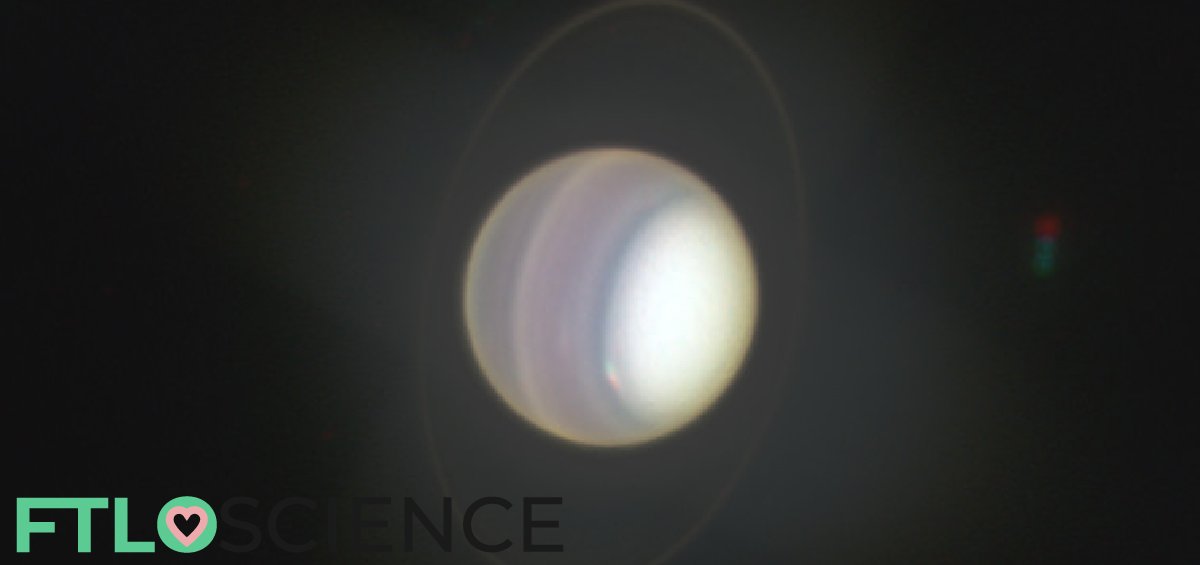
Featured Image: Uranus in Near-infrared by Judy Schmidt
Reference
- Pecsok, R. L., Shields, L. D., Cairns, T., & Mc William, L. C. Modern Methods of Chemical Analysis, (1976).
- Schwartz, A. T. (1997).?Chemistry in context: Applying chemistry to society. William C. Brown.
About the Author

Sean is a consultant for clients in the pharmaceutical industry and is an associate lecturer at La Trobe University, where unfortunate undergrads are subject to his ramblings on chemistry and pharmacology.